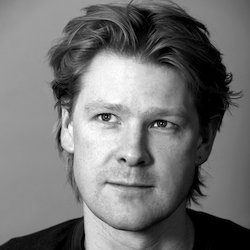
Data storyteller RJ Andrews is a practicing data storyteller and creator of several books on information graphics. He helps organizations solve high-stakes problems by using visual metaphors and information graphics: charts, diagrams, and maps. He recently produced designs for The White House, Google, and MIT. RJ’s recently published Information Graphic Visionaries is a new book series from Visionary Press celebrating spectacular data visualization creators. RJ's first original artwork, an elevation map of California created on an antique typewriter, was recently acquired for Stanford University.
Episode Description
Good data visualization can catapult a news story or research article from ho-hum to extraordinary. A new book series is exploring the careers of information graphic visionaries. And that's the focus of this episode of Stats+Stories with guest RJ Andrews.
+Full Transcript
Rosemary Pennington
Good data visualization can catapult a new story or research article from ho hum to extrordinary. A new book series is exploring the careers of information graphic visionaries. And that's the focus of this episode of stansson stories where we explore the statistics behind the stories and the stories behind the statistics. I'm Rosemary Pennington. Stats and stories is a production of Miami University's departments of statistics and media, journalism and film, as well as the American Statistical Association. Joining me as always is regular panelist John Baylor Emeritus Professor starlett over again. Joining me as always is regular panelist John Baylor emeritus professor of statistics at Miami University. Our guest today is RJ Andrews, Andrews is a practicing data storyteller and creator of several books on information graphics, he helps organizations solve high stake problems by using visual metaphors and information graphics. And he's recently produced designs for the White House, Google and MIT. Andrews recently published information graphic visionaries is a new book series from visionary press, celebrating spectacular data visualization creators. He's here to talk with us about the series and data storytelling more widely. Thank you so much for joining us today, RJ. I guess just to start the conversation, where did this this book series come from? I have to say they're really extraordinarily beautiful. And the fact that these can be created and have these, these visualizations recreated such at such a scale is nice, and they are just beautiful books. I wonder sort of what the what the impetus was for them.
RJ Andrews
Oh, thank you so much. So part of part of the goal of making the books was to make beautiful books. Today, in 2024. If a book is to be real, and not a PDF, it has to it has to deserve it honestly, you know, most books, you know, are should just be a PDF, or a blog post or maybe even a thread. And so if you're gonna make a book reel, you're gonna go through all that work of actually printing it and shipping it around the world. Like it has to be really worth existing in the real world. And so that's, that's the type of book that we set out to do. There's a lot of sort of joy and optimism behind. There's a lot of joy and optimism behind behind these books. But there's also a lot of, you know, frustration, and cynicism. Sorry, I'm pausing because my doorbell is ringing. And so I'm going to restart this answer. No worries, I don't know if you can, I don't know if you can hear that. No, you can't. So there is a lot a joy and optimism that sort of propelled and motivated these books. And we can talk more about this. But there's also a little bit of like, sort of like cynicism and frustration that propels them. So I think what is the joy of optimism, I think that the joy and optimism is all about recognizing that data graphics are only becoming more and more important, and that books about data graphics are starting to mature to a point that data graphics are ready for this level of critique, certainty, scrutiny, but also elevation, right? Because when we make beautiful books on a subject, what do we do, we are elevating that subject. And so that is one of sort of the broader, like strategic goals of this book is to call people attention to data graphics, something worthy of praise in the same way that the Mona Lisa is worthy of praise in the same way that equals MC square is worthy of praise.
Rosemary Pennington
I'm curious about the cynicism that is propelling them if the optimism is let's let's look at these things as art that we should appreciate and their history. What is the cynicism behind them?
RJ Andrews
I think the cynicism sort of arrived from some of my early publishing experiences with traditional the traditional publishing industry. And so this book series is an entrepreneurial effort, as much of as a creative effort. And so, frankly, the first time I published a book, the books fell apart, the inks were out of register, and they just, they just weren't beautiful, like, like, why bother? Why bother making a book that falls apart? And inks are blurry. And so I went above and beyond, not by myself but with, you know, an international team of people who are the best in the world that making beautiful books in order to bring these beautiful books, you know, onto your onto the table. And, and it was worth a lot but it like it like it was worth the effort. And it really was because because because they're here and there's something that you're proud of, and the act of making something beautiful is in some sense, the reward itself. Have these books were created in the midst of the COVID 19 pandemic, when frankly, everything was pretty, pretty, like not happy. And this project gave, you know, our team an opportunity every day to go into a space, that was joyful. It was also a space that we could completely control, there was nobody telling us how to do it. And so and so it was sort of, you know, when everything is sort of horrible and awful, and, and you don't have control, this project was a way of us sort of asserting our ourselves in the world.
John Bailer
You know, I think you've you nailed it in terms of the coffee table book, I mean, I, I found myself just paging through and really enjoying these images. And it just for for folks that are listening, you know, there's there's a one of the books is on mortality and health diagrams, Florence Nightingale, another as the graphic method and a third is the maps of history. And, you know, I have a confession as someone who, who visited the Florence Nightingale museum when it was opened in London, in part because of just so be so fascinated with her work. And also having a spouse who was a nurse, there was sort of a dual dual interest, and the amazing maps of Jon Snow and thinking about the cholera epidemic and all those though these these amazingly impactful renderings that I found beauty and they were always in my office. So I, you know, I'm a complete fan of trying to do this I, you know, I've got, I got Rosemary rolling her eyes that she thinks just stop waxing poetic John, you know, ask a question. Well, you got this guy here. So as I, as I look at these, these beautiful constructions here, why did you choose these themes, these topics for the books, and the contributors that you selected?
RJ Andrews
So these, these three books, so I think that the first question is, like, Why three books? Why not just one, right? Okay, so we developed a single book first, okay, and that was Florence Nightingale. And then, march 2020 happened, and I got pulled away working on the pandemic, and everything got stalled. For a while. While it was stalled, the other books came together. And from an entrepreneur perspective, it cost the same amount of money to get somebody's attention on a three book purchase, as it does a one book purchase. So why not launch a series? And what's incredible is that in our first year of sales, I think 89 90% of our purchases were of the entire set, not just volume, which just completely blew me away. Right. Okay. So that's why we do three books, why these three books, these three books represent the three stories that deserve to be told the most, right? These are the three most spectacular stories from the history of data graphics, you know, from my personal perspective, that haven't been told yet, right? Like, these are sort of like unknown, like insiders only sort of, like are familiar with these particular stories. And even then the insiders, you know, people like nerds like me, like, these stories were under explored, right. And so there was actually original research necessary to pull them together. But we have I mean, there's 20 3040 stories that could be told about the history of data graphics, you know, at a similar level of celebration.
Rosemary Pennington
You know, it's I, as I was thumbing through the Florence Nightingale book, I was sort of against struck by those, those graphics that she produced in the people she was working with, and how I think, you know, for me, I did not know much about her data work until I started working on this podcast, frankly, and had no idea that was part of who she was, I knew her as, as this sort of legendary nursing figure, but not as this person who was creating this data. And I wonder if you could talk through the other two individuals that you are profiling in the books and why those two in particular felt like they needed to be included in this series.
RJ Andrews
So the, the the three characters, the three visionaries, all are in my head, at least they stick out a particular territory. And so there's some diversity to them. They're each from a different country, they each had a different profession. They each use graphics, data, graphics to do a different thing to accomplish a different thing. They each use different types of data graphics. They each operate at a slightly different time period. So there's some diversity to all of them. And so if we go chronologically, the first is an American teacher named Emma Willard. And she used she used data graphics, particularly maps of history, to educate, and not only to educate but to sell textbooks. So she was both an educator and education pioneer. She's known in America as as being the early champion of educating girls and young women. But she also sold a million textbooks in her life, right and so she has this fantastic story where her graphics get, frankly, weirder and weirder. Progressive and, and why are they getting like stranger and stranger? Well, what is because she's actually tuning her graphics to be more effective in the classroom, but she's also tuning her graphics to You have been more effective in the market, she has to stand out from all her textbook comp competitors. Okay, so that's, that's the first point, that's the green volume. That's Emma Willard and mo, mo will, book is is, is is beautiful. That middle volume is the nightingale volume, which we've already touched on. And then the final volume is at 10, Jules Marais. And Moray is the first to publish any sort of visual history or visual catalog about data graphics. And this is called the graphic method. And as, as I like a super nerd insider, I love the graphic method. The problem with the graphic method is that it's been stuck in French for 100 100 some odd years. And so his, his original text is gorgeous. And all of his illustrations are spectacular, but it's been stuck in French. And like, we got to get it out of French and get it so that like a bigger chunk of the world can read it. And so that was the big impetus behind behind that book.
John Bailer
So can you talk a little bit about the process of the contributors to this effort, I missed this, this is really a remarkable collection. So So what was needed to put this together, and there's these massive appendices that are part of it, that includes some of the original, the original pieces being reproduced.
RJ Andrews
So what's so like, the thumbnail sketch of the team is that each of the specific volumes has a, what we call an editor. And that's a person's name on the cover. And so each volume has, you know, I'll say an expert or historian, or some somebody basically who's insane enough to devote, you know, a couple of years of their life to making this book, you know, come true. So that varies volume to volume, I lead the Florence Nightingale volume, you know, in that capacity, the, but then continuous throughout the book is is our series designer, and his name is Lorenzo Phantom. He's his definition. Here's my definition. And he you know, I'm, I am an amateur book designer, I'm a bibliophile, I love books. But I don't have the same skill with designing books that I might have with designing a bar chart, which is my expertise, Lorenzo Fenton can can take book design and take my ideas, and I can lift them as high up as I think it's possible to go. And that is his starting point, he takes that and then he helps it soar even more. And so both from page layout, and typography, and image correction, and photography of original resources, and color correction. So everything from the design all the way through to the production, and we did print all of these, you know, in his backyard, over in Italy, you know, one of the one of the finer presses in the world, you know, the paper selection, all that stuff that really makes the thing feel fantastic. Each of those little decisions, matters. And Lorenzo let all of that.
Rosemary Pennington
Do you have any plans to expand this series? So you have you have these three books here as a starting point, any thought of like expanding it to other visionaries? Who could sort of build on this? Oh, yeah, we
RJ Andrews
have, we have a roadmap, you know, with a couple of dozen visionaries, identified? And the question is, where do you where do you go next? Do you need to do another three books? Or do you just as a single volume? Quite honestly, the, the expense of doing three books at once is was extreme. And so my guess is that the next one will be a single volume. And okay, so which single volume? If you only get to do one, who do you do? And the person whose name I won't reveal? But like, what, what's the goal? Like, what what do they have to satisfy? We've staked out a particular territory with these existing three bucks, that's a territory and craft a territory in, you know, sort of persona. And do you play within that territory? Or do you push its boundaries? Do you go do you go wider? And I believe the answer is you go wider, right? You actually, you actually you go outside and in general, where my interest is for not only the next one, but the next couple books is to is to step outside of romance languages. And so to look to look at, to look at content, outside Romance languages, and so that's, that's my general intuition. Not that there isn't quite a lot, you know, still to celebrate and elevate, you know, inside Romance languages.
Rosemary Pennington
You're listening to stats and stories. And today, we're talking with RJ Andrews about data visualization and the information graphic visionaries book series. So
John Bailer
now I want to I want to look back to kind of who, who you are and what you do before books, or maybe during books as well. And then as you're you're self described as a data storyteller. Can you can you flesh that out a little bit for us?
RJ Andrews
Yes. So I'm a data storyteller. I make charts, maps, and diagrams usually are ideally in high stakes situations, you know, so places where a chart is going to be really valuable, and really appreciate it.
John Bailer
So the, how does one become a data storyteller? You know? So I think of that from the context of a statistician asking that question who often found themselves needing to tell stories from data? But in your, how did you become one? How did you prepare for this? And can you give an example that you can share? I know some of you might have private, private companies you're working for that you can't share. But could you talk just a little bit about kind of examples of the kinds of things you might work on?
RJ Andrews
Of course, the I don't. So how do you become one, I think you'd become one out of a lot of probably stubbornness. The. So when I was in grad school, I kind of recognized that I hated how information was presented on the internet, I also had already recognized that I hated working as a pure engineer, I just felt that a very small portion of you know, my person was being used to, you know, to do work. And, and so I arrived to data graphics, that's a traditional way of, that's a typical way. So people arrive to data graphics from the world of graphic design, they arrive from architecture, because we don't build interesting buildings anymore. So architects look for something else to do. And then engineers, like me arrive to data graphics. So it's sort of like a traditional route to arriving to the field. You know, I was prepared, because I have technical know how, and an eye for design. And and that's, you know, partially my upbringing by my parents, and partially my formal training in engineering. But really, it's sort of the interest in the intersection between technology and people, right, human problems, what what I learned as an engineer is that build technologies pretty much never the problem, like technology's like, we kind of solve technology, honestly, like, it's people, people, the hard part, people is what makes things thorny, and, and complex. And that's also like, where all the magic and wonder is to. So, so. So that's, that's how I arrived to data storytelling, and how do you get good at it, I think that how you get good at it is you survive, meaning you keep working at it, and you figure out a way to persist. Because as you persist, there's a sort of combinatorial sort of effect of you learn more, but also all your competition was fall away, you know, everybody else quits. Because it's it. It's a strange field. It's a niche field. And, you know, it's one where almost everybody has to kind of figure out their own business model, in order in order to in order to thrive. And so I'm very lucky, you know, through some chance, and quite a lot of people who have been very generous to me, over the years that I'm still here, and I've been able to, you know, I'd be been able to stick around long enough to learn, learn a bit.
Rosemary Pennington
I'm looking at one of your infographics on your site right now bloom. So I'm a gardener. And this one caught my eye immediately. And so for those of you who obviously can't see it, it is a graph that sort of shows the the blooming cycle of the gardens at Monticello. And I just kind of was wondering, as I was watching this, sort of what spurred it and kind of how did you why did you decide to approach it in this way? Because I don't know that I've seen anything presented in quite this manner.
RJ Andrews
Yes. So I think that there's always a lot of different aspects that like, that inspire a chart. So sometimes it's content, sometimes it's foreign, usually have a piece of each, so you have some kind of story you want to tell, but you also have, like, a sense of a way that you want to tell it. And, and so there's a there's a phenomenal creator named Eleanor lots, who is I believe, now at the New York Times, I think she's still at the New York Times. She wasn't when she when I discovered her, but she would make these huge, like gift contraptions. And so looking at her work, I was like, I want to I want to try to do something like that. Okay, so that's like the form, right? The pure form, like I want to make a gift, I want to make a really fancy gift. And what you're looking at is a gift. It's a huge gift. I think. There's the content. And so what's the content? Well, the content is I was, you know, I travel them on a cello. And I forget, I forget the spark, but at some point, I figured out that they actually record their, their flower blossoming data. So when at Monticello, do flowers start blooming? And they have, you know, in a rather extraordinarily, you know, vast garden of different different horticulture and so and so that's sort of like that's like the intersection, right? Like, you have this idea for a story. You have some data, and you have you have a format that you want to play with. And you play you play out in public, for a lot of reasons. One, one you're playing because you're trying to figure out a new technology, right? And that technology if you feel figure that out, maybe that becomes your thing, maybe we'll do it again, maybe we'll figure out you hate it, you never want to do it again. But you're also playing in public, because you're trying to attract attention to yourself, you're trying to get you're trying to attract, you know, first off, you're trying to attack like mentors, you know, people who can teach you, people can give you a critique, you know, now, you know, it's several years since I published that. Well, what do I do now? Like, now? I'm on backchannels? This is the thing I'm working on. What do you think? How can it get better? You know, what else should I be looking at? Where do you think they should go? You know, those types of questions. But when you're starting fresh, you don't have those, you don't have those back channels yet. And so you're putting a lot of like, you know, work out in public, and, and hoping that people respond enough so that you can learn how to do it better the next time.
John Bailer
Yeah, I appreciate sort of getting a little glimpse into your creative process and the idea of content and form. And I've enjoyed seeing some other examples of of content and form that that you've you've featured, the Neil and Buzz interactive for Apollo 11 was one that I found really, really attractive, I also would give a tip of the hat to the the hand type California elevation map that also brought a smile for me. But could you talk a little bit about kind of this, this story that you wanted to tell about the Apollo 11 and the moon, the lunar landing, right,
RJ Andrews
so we were approaching the 50th anniversary of the landing. And I, I am, I don't know if I'm still a space nerd. But I certainly was a space nerd at some point. And I think that I was very lucky that I got to work for NASA at the Kennedy Space Center, I worked on the on the shuttle, and the facilities around the shuttle for a little bit. And it was an extraordinary experience. But the even though I'm an engineer, and I worked for NASA, I realized that I had like, very little human context about what happened on the moon. Like I knew that they sort of like one small step for man. And they planted a flag. I knew they took some photos, and there was something about experiments, but I had no idea like, what did they do? How long were they there? Like, what's the territory that they covered? Like I had no human understanding of what the heck went on up there. And, and so it was that sort of that sort of curiosity gap, right? That, that that that that propelled, propelled the story into being and so what the story seeks to do is to give you is to give you a human sense of both the time and space involved with that first lunar landing.
Rosemary Pennington
I, as I was looking through these, I teach a multimedia journalism class and in the class, the students have to create very basic infographics, it's just a chance to, for them to get their hands wet, doing something and then they go to a more advanced class eventually, where they're actually doing something a bit fancier. But they're always a little daunted by the idea of visualizing data. And I show them a lot of, you know, WEB DuBois stuff and Florence Nightingale stuff, some of those early infographics that like, like, look, people drew these by hand, you can manage this thing that you're working with. And I wonder, what advice would you have for someone who is just starting down this path of exploring, like what they can do with data of is like, what should they be thinking about? How should they approach things? Like, what advice would you have for them?
RJ Andrews
So I think one is I would, I would make sure that they understand some of the context around both Nightingale and Dubois, either or both. So first off, they both were teams of people in order to produce those graphics, and that those teams of people or them themselves were, were already experts at making charts. And so DuBois in particular, can be, I think, a little misleading, because his charts appear, I wouldn't say crude, but like a little Homespun. And part of that is how they were produced and like the time pressures that they're producing. But it's also like very specific storytelling decisions that he's making. Dubois published a year earlier, lots and lots of charts that, you know, we would consider more rote and traditional. And so don't be misled that, that. And because these things look simple, or easy that they are, right, like they're actually being created by very, very sophisticated makers who have a lot more experience than you do if you're just starting out. And also like, survival, bright bias, right? And so, why are these charts famous? Well, they're partially famous because Dubois is famous and Nightingale is famous, and they're not famous first for their charts. They're famous for other reasons. And, and so there's a certain, like, certain kind of survival bias when you look at, like, a lot of stuff from history is like, these are the winners. Like there's, there's, you know, the dustbin of charts that we've forgotten about is is is vast, and so, you know, don't it's fun to look at these inspiring things, but don't let them you know, be be be too daunting. And so that's maybe the first thing to think about. The second thing to think about is Don't, don't start with trying to make your own kind of custom chart, I would say, focus really hard on a bar chart or a line graph, probably a bar chart, and try to get really, really good at making a bar chart, because most of our bar charts today suck, they just do not do as much as a bar chart can do bar. And so I would actually study really, really simple bar charts, like a lot of really, really simple bar charts, and learn how to make a really, really good bar chart because you can tell fantastic stories with just by by using bar charts.
John Bailer
You know, one of the things that I think about what is how much technology changes and some of the tools for for even producing these, these images have changed. When I was in graduate school, I was I was playing with chemistry software, because it was one of the few tools for producing a three dimensional object at the time. So it's, it's just to me fascinating to think about, you know, when you do have have the, as you mentioned, the idea of, of content and form, but but some of the form is also shaped by some of the tools. So do you find yourself always, you know, kind of gearing up to? Or keeping current with new tools? Or how, how do you sort of balance, kind of thinking about the stories that you're telling, and the tools that you're bringing in to tell the stories,
RJ Andrews
I have one set of tools that is constant through all my work, paper and pencil is it is the most, it is the most useful and sort of creative. The linkage between the human mind and, and, and external reality. Yep. And so that's constant, and nearly everything else is a mess. I think that one thing is once you once you learn how to kind of like learn like three or five tools, you realize that they all operate under very similar metaphors. And so it becomes easier and easier to pick something up. There's a lot of creators and I sort of sometimes wish I was just kind of creator who have one digital tool that they they kind of do everything in and that's their thing. And all their work, you know, gets a certain aesthetic, you know, look, and you know, maybe sometime I'll find my vibe, or I'll settle in a vibe, but right now, I usually, you know, have to relearn a tool, you know, for each new project. And so, I've been working on a project related to, let's say, American landforms. And we're doing it with a tool, a 3d modeling tool called blender, I'm doing this with with with a creative collaborator out of Shanghai. And so we're doing it with this 3d modeling tool name called blender, which she has a lot of experience in and I had no experience in going into it. And so that's really interesting, because I get exposure to some of, you know, her talent and expertise, you know, just from the technology side. And you know, what's, what's the end result? Like? I don't know if I'm going to be spending a lot more time in this tool. It's, it's really hard to do or really slow and, and so, yeah, always, always learning.
Rosemary Pennington
Well, that's all the time we have for this episode of stats and stories. RJ thank you so much for being here
John Bailer
Thank you RJ
RJ Andrews
My pleasure. Thanks so much.